Fructose


Diabetes Management Application
Just turn your iPhone or iPod touch on its side to make the graph appear. You can flick with your fingers to turn the pages back up to fifteen days in the past.
The red dots indicates the blood glucose level while the blue bars indicates insulin intake. The blue triangle shows the insulin’s peak action time as well as its action’s length. The yellow line indicates the current time.
The pie chart indicates the percentage of measured values that are in the target range you defined.
Fructose is an application to make it easier to handle type 1 diabetes on a daily basis. It has been optimized so that you can quickly enter your blood glucose measures and insulin intake and let you instantly see the evolution of your blood glucose on a graph as well as how long the insulin will be acting and when it will be at peak action. This lets you better handle diabetes by seeing how your blood glucose is evolving over time and letting you know how your insulin is acting.
Fructose also lets you set a minimum and maximum target for your blood glucose and let you see how well you are doing on a pie chart. You also get an estimated average over time as well as the corresponding glycosylated hemoglobin (A1C value in % or mmol/mol).
Copyright 2009-2011 Wilhem Meignan
Strawberry icon by Nicu Buculei
wilhem [dot] m [at] gmx [dot] net
Important information: this application is for people with type 1 diabetes under insulin therapy. The estimated insulin action represented on the graph is for rapid acting insulins1 which are normally used in combination with a second, long acting basal insulin. The basal insulin is not represented on the graph since its action should be almost constant within the day. The insulin action represented on the graph is only an indication, please contact your health specialist for more accurate information about the action profile of your insulin in your body. This application come without any warranty, you are still the one responsible for handling your diabetes.
1: Rapid acting insulins are known under the following brand names: Apidra®, NovoLog®, NovoRapid®, Humalog®.
Screenshots
Features
-
• Very fast data entry
-
• Log Book with values for last fifteen days
-
• Graphical representation of blood glucose level and insulin action
-
• Blood glucose in mg/dL and mmol/L supported
-
• Settable target blood glucose range and statistics in pie chart
-
• Estimated average blood glucose and glycosylated hemoglobin (A1C)
The log book view shows you the values you entered over the past fifteen days. You can add, edit and delete the values at any time.
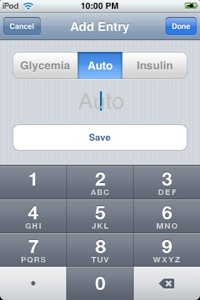
You can very quickly enter a new value by typing it on the number pad. Fructose automatically saves the given value as a blood glucose measure or an insulin dosis depending on the value (the limit between the two can be configured). Use the “Save” button if you want to enter several values at once otherwise pressing “Done” will automatically save the given value.


This graph shows the average blood glucose for each hour of the day using all the data in the log book. The yellow dot is the average and the bars above and bellow it indicates how much the values are varying around the average. The background colors reflects the target values that are given in the application’s settings. The green dot indicates the value of the last blood sugar measure.
